5 Questions You May Have asked: What is Economic Complexity and Which Countries are Increasing Their Economic Complexity?
A Metric that Measures a Country's "Know-How"
1. What is Economic Complexity?
Economic Complexity measures a country's knowledge and capabilities. It reflects the depth of expertise within a society. For instance, activities like gold mining require less specialized knowledge and a relatively small workforce compared to other industries. Many countries, from wealthy ones like Canada to developing ones like Mali, engage in gold mining. However, industries like semiconductor or airplane manufacturing demand a higher level of expertise and involve a larger network of people & firms including people and companies that encompass design, equipment production, research, component manufacturing, assembly, packaging, testing, distribution, marketing, sales, integration, after sales support and service to end-of-life management. Complexity arises from the collective knowledge in society, leading to the formation of intricate networks. This fosters the development of competitive firms and value chains.
2. What is a good metric to Measure Economic Complexity?
Trade is a valuable indicator of a country's knowledge management because it signifies two things:
1) The country can produce that good (a helicopter)
2) The country’s good is of enough quality that it is sought after by the globe (Countries C,D, and E want to purchase a firm’s helicopter from Country F)
Trade matters because just building something isn’t enough. While countries like Brazil, India, and Russia have aerospace industries, their exports in this sector are comparatively lower. The European Union has firms like Airbus, Thales, and Dassault Aviation that exported $70B of aircraft to the globe in 2021. American firms like Boeing, Lockheed, and Northrop exported $27B, Brazilian firms like Embraer or Helibras exported $2.6B. Meanwhile China’s firms like China Aerospace Corporation (CASC) and their space company COMAC sold $1.6B abroad. Russian aerospace firms only exported $430M in 2021.
How do you calculate Economic Complexity?
In a nutshell, complexity is calculated by:
1. Product Diversity: This measures the variety of products a country is capable of producing. Having a diverse range of products is beneficial for economic complexity.
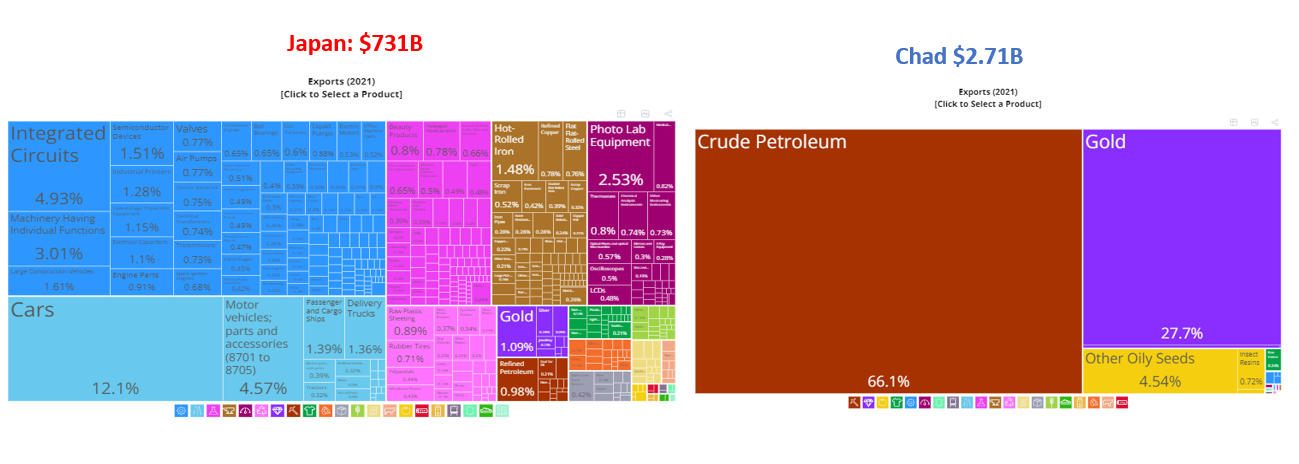
Chad really only makes Crude Oil & Gold, and Crude Oil is Chad’s only billion dollar product. Chad lacks much domestic industry, so Chad exports crude oil through multinationals and trading firms like Glencore. Meanwhile Japan sells a consortium of different products, many of which are in the tens of billions: cars (Toyota), passenger ships(Mitsubishi Heavy Industries), machinery(Komatsu), semiconductors & microchips (Sony).
2. Product Difficulty/Ubiquity: This assesses the complexity of producing a product by considering how many countries are capable of manufacturing and selling it. For instance, while some African countries may have natural resources like gold, many other nations also engage in gold exports, often surpassing the quantities sold by those African countries. To illustrate, Burkina Faso exports $7.71B worth of gold, while the United Arab Emirates exports over four times that amount ($32B) in gold, along with more complex products like refined petroleum (jet fuel, gasoline) and broadcast equipment, each in the tens of billions.
3. How could you categorize Countries by Complexity?
Economic Complexities are classified into three levels based on their Economic Complexity Index Score (ECI):
Negative ECI indicates reliance on unsophisticated and resource-intensive products, such as mining, crude oil extraction, and basic goods.
A Zero ECI represents a mix of agriculture and manufacturing, signifying intermediate complexity.
Positive ECI signifies the production of complex and technologically advanced goods like microchips, single-purpose robots, and satellites."
Level 1: ECI index between -1.5 to -2.
These countries are highly resource dependent with limited economic diversification & industrialization.
Let’s go back to Chad. Over 90% of what Chad sells is crude oil & gold. If oil prices decrease or gold prices decrease, then Chad’s entire government budget, central banks’ reserves, and economy is in jeopardy. It means massive trade imbalances which could deplete Chad’s foreign reserves to import food, medicine, or fuel. Chad’s mining of gold is highly artisanal, meaning that people risk their lives to dig gold without tools or very little machinery, safety standards, or protection. There’s approximately 300K artisanal miners in Chad.
Chad has very little capacity to produce oil on its own, so the government has made joint ventures with foreign companies like America’s Exxon Mobil, Taiwanese Chinese Petroleum Corp, and China Natural Petroleum Company
Whenever oil prices have declined globally (1980s-2000s, 2014-2020) Chad’s economy has stagnated or declined. The only time Chad experienced economic growth was when oil prices were increasing every year from 2000 to 2014.
Other examples: Guinea (its economy depends on the price of Gold & Bauxite) , Papua New Guinea (depends on Natural Gas, Gold, Copper, Crude oil), Democratic Republic of Congo (depend on copper & cobalt), Nigeria (crude oil & gas), Mali (gold)
Level 2: ECI index between -1.0 to -1.5.
These countries are slightly better, yet still resource dependent with limited economic diversification & industrialization.
A perfect example of this is Tanzania. It is still very commodity dependent with Gold, Copper, and other metal ores making up 50% of exports instead of 90% for a country like Chad. Tanzania allows sophisticated gold mining firms like Canada’s Barrick Gold and South Africa’s AngloGold Ashanti to own and operate gold mines and Tanzania’s government firm STAMICO also owns, joint-owns, and operates gold mines.
Tanzania also exports over a billion dollars in food and beverage products like Rice, Dried Legumes, Coffee, Corn, and oily seeds. Tanzania also has a meager, $100M textile industry selling rope, packing bags, and men’s suits.
Other examples: Angola, Gabon, Mozambique, Cameroon, Sudan, Mauritania, Afghanistan, Ivory Coast, Libya, Yemen, Iraq, Venezuela, Madagascar, Nicaragua, Congo-Brazzaville
Level 3 ECI index between-0.5 to -1.
These countries are have very limited economic complexity, with some industrialization.
A great example is Bangladesh. 90% of its export economy is clothes, garments and footwear. It makes Suits, T-Shirts, sweaters, and etc.
Other examples: Bolivia, Uganda, Algeria, Burma, Togo, Ethiopia, Zimbabwe, Ecuador, Namibia, Zambia, Laos, Tajikistan, Botswana, Cambodia, Peru, Niger, Benin, Senegal, Pakistan, Turkmenistan, Azerbaijan, Honduras
Level 4 ECI Index is between -0.5 to 0. Low Level of economic complexity
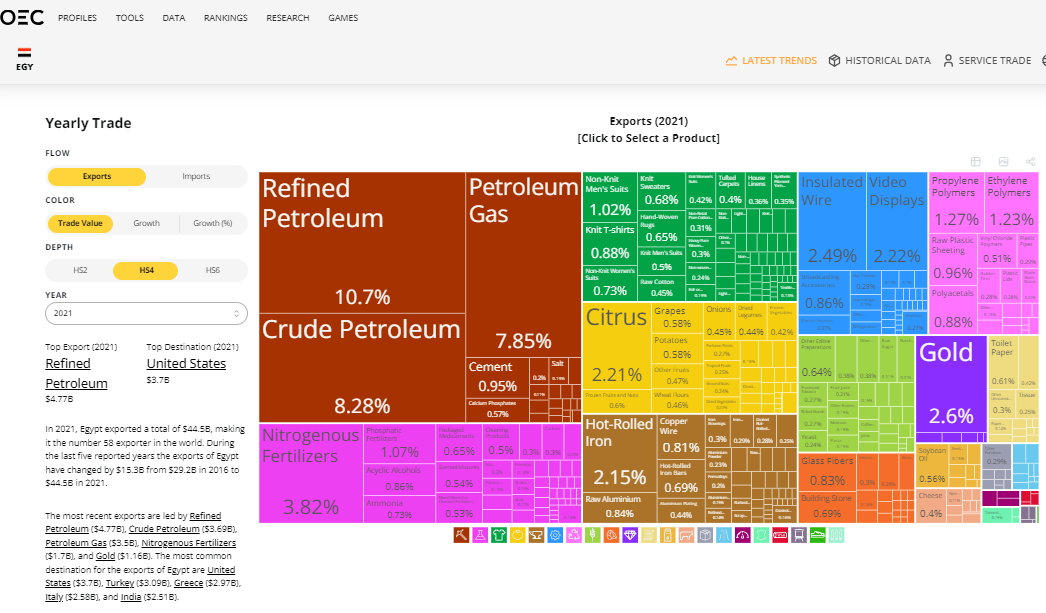
Egypt is the quintessential example. Egypt makes more refined petrol than crude oil, and also makes textiles, metal products, some machines (gas turbines, electric wires), petrochemicals and fertilizers. Egypt is decently diversified and has some industrialization beyond textiles.
Other Examples: Kenya, Australia, Sri Lanka, Paraguay, Uzbekistan, Kazakhstan, Guatemala, Jamaica, Chile, Oman, Albania, Armenia, Qatar, Kyrgyzstan, Egypt, Iran, El Salvador, Moldova, Georgia, Dominican Republic
Level 5 ECI Index is between 0 to 0.5. Low-Mid Level of economic complexity

Countries include: Jordan, Argentina, South Africa, Vietnam, Uruguay, Colombia, UAE, North Macedonia, Tunisia, Costa Rica, Panama, Greece, Brazil, Kuwait, Lebanon, New Zealand, Russia, and Ukraine
Level 6 ECI Index .5 to 1.0. Mid Level Economic Complexity

Countries include: Portugal, Bulgaria, Bosnia, Norway, Philippines, Serbia, Spain, Croatia, Belarus, Canada, Saudi Arabia, Lithuania, Thailand
Level 7 ECI: 1.0 to 1.5. Upper Middle Level of Economic Complexity
China is a great example of a nation with upper middle complexity.
Examples: Poland, Denmark, Romania, China, Malaysia, Mexico, Netherlands, Hong Kong, Israel, Italy, Belgium, Ireland, Slovakia, France, Hungary, Finland, Slovenia, United Kingdom, and United States
Level 8 ECI 1.5+: High Level of Economic Complexity
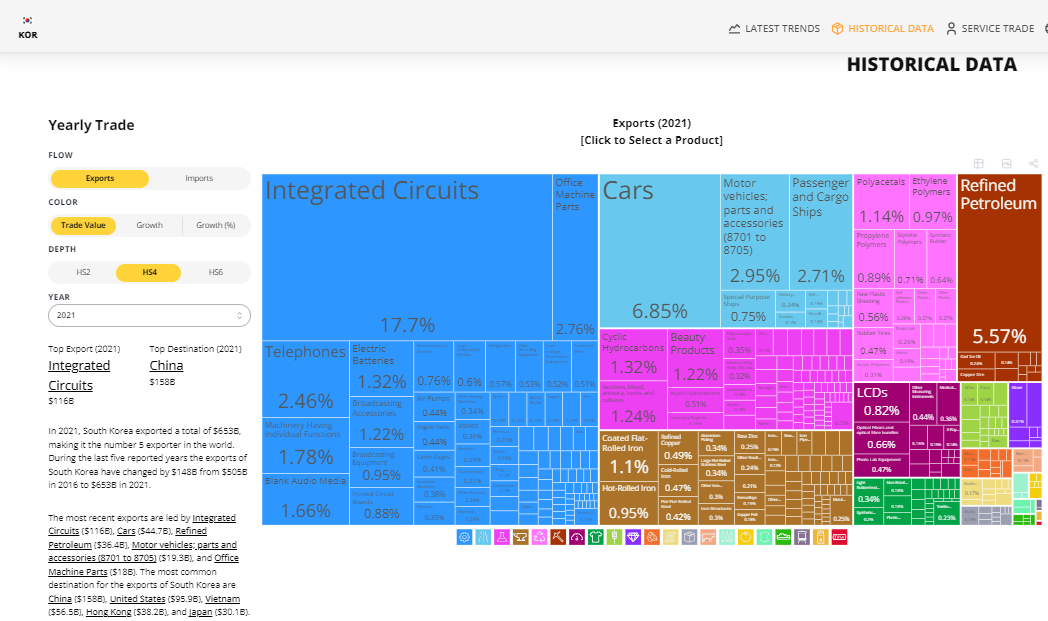
These are the most complex economies on earth: Here is South Korea below:
Samsung and SK Hynix make microchip and semiconductors. Hyundai and Kia make cars, The conglomerate SK Group made gasoline, diesel, and other related products. The place that makes the most advanced Semiconductor chips on earth is Taiwan. Taiwan has several world leading semiconductor manufacturing firms which include TSMC, UMC, and Foxconn. These firms make chips for Nvidia, Apple, AMD, QUALCOMM and etc. for AI/ML, electronics, automotive, and industrial applications.
World’s Most Complex Economies: Austria, Sweden, Czechia, Singapore, Germany, South Korea, Taiwan, Switzerland, and Japan
4. Which countries have been improving/worsening their complexity over the past decade?
Methodology: I analyzed ECI index data from 2011 and 2021, calculated the percent change for each nation, and categorized their growth based on mean and standard deviation ranges
Massive Progress (Above 3 standards from the mean… SUPER EXTREME Outliers)
South East & East Asia: Burma & Cambodia
Big Progress: (Between 2 to 3 standard deviations from the mean change rate)
Sub-Saharan Africa: Congo-Brazzaville, Gabon
South Asia: Bangladesh
Middle East & North Africa: Morocco, Iraq
Central Asia: Turkmenistan
Europe: North Macedonia
South East & East Asia: Laos
Advancing: (Between 1 to 2 standard deviations above the mean change rate)
Sub-Saharan Africa: Kenya, Nigeria, Angola
Central Asia: Kyrgyzstan, Uzbekistan
South Asia: Pakistan, India, Sri Lanka
Latin America: Uruguay, Bolivia, Nicaragua, Colombia, Dominican Republic, Peru, Cuba, Guatemala, Costa Rica, Honduras, El Salvador
Middle East & North Africa: Iran, Kuwait, Egypt, Turkey, Tunisia, Oman, Saudi Arabia
Europe: Slovakia, Greece, Croatia, Serbia, Bosnia, Portugal, Bulgaria, Romania, Lithuania
Southeast & East Asia: Singapore, Malaysia, Taiwan, South Korea, China, Philippines, Indonesia, Thailand, Vietnam, Hong Kong
Barely Any Change in any direction: (Within 1 standard deviation from the mean change rate)
Sub-Saharan Africa: Uganda, Mozambique, South Africa, Tanzania, Ghana, Namibia, Ethiopia, Ivory Coast, Mauritania, Senegal, Zimbabwe, Guinea, Togo, Zambia
Caribbean: Jamaica
Latin America: Argentina, Ecuador, Panama, Mexico, Chile
Former USSR: Russia, Ukraine, Kazakhstan, Azerbaijan, Georgia
Middle East & North Africa: Qatar, Yemen, Jordan, Lebanon, Algeria, Israel,
East Asia: Mongolia, Japan
Oceania: Australia, Papua New Guinea, New Zealand
Europe: Norway, Finland, Albania, UK, Switzerland, Slovenia, Belarus, Ireland, Poland, Denmark, Belgium, Netherlands, France, Hungary, Germany, Spain, Italy, Czechia, Austria
North America: United States, Canada
Worsening Nations: Burkina Faso, Botswana, Brazil, Cameroon
Retrogression:
Venezuela, Mali, Democratic Republic of Congo
Significant Retrogression:
Chad, Libya
Any nation that I didn’t mention didn’t have enough data at the year 2011.
5. What’s the Conclusion? Where Will growth be?
For developing countries (countries where the average person makes less than ~$14K per year in 2023 money), focus on those with higher economic complexity relative to their income levels. That’s most likely where fast growth is happen non discounting external shocks. Historical examples include the rise of China and India which decades ago had more complexity relative to their income levels (this is still true today).
Less complex countries can still grow, often driven by spikes in commodity prices (e.g., copper for Zambia & DRC, oil & gas for Nigeria & Angola, gold for Mali, Ghana, and Burkina Faso). This contributed to Africa's rapid growth from 2000-2014, during the 'Africa Rising Era'. However, China's 2014-2015 shift from export lead manufacturing to domestic consumption and the shale revolution in America led to a crash in commodity prices post-2014 to 2021. This adversely affected undiversified petrostates like Venezuela, Nigeria, and Angola. Consequently, most of Africa, except for a few, experienced stagnation or regression. The commodity crash has hurt most of African economies so much that most Sub-Saharan African people have the same incomes per capita as they did in 2015. Exceptions include countries like Ethiopia and Kenya, which have been diversifying and experiencing relatively faster growth. These countries were also never big commodity exporters to begin with.
The graph below plots gross income per person (Y-axis) against economic complexity (X-axis). Bottom-left quadrant: low income underperformers not increasing complexity enough (e.g., Mali, Chad). Upper-left quadrant: countries with relatively decent living standards but less complex economies (e.g., Gabon, Cuba). Upper-right quadrant: relatively complex economies with high incomes for a middle income nation (e.g., China, Malaysia, Mexico). Bottom-right quadrant: underdog countries poised for growth (e.g., Vietnam, Indonesia, Philippines, India).
It appears for the time being, that the future of Southeast Asia looks bright. This seems like the decade for the Association of South East Asian Nations (ASEAN), provided that the South China Sea stays geopolitically stable for the time being.
Links are underlined!


Thanks for sharing this insightful content. In reading this, I also came to the conclusion that the more economically complex a nation is, the higher their propensity to spend on technology and adapt new technology.