


Evaluating My Growth Predictions: Insights from the World Bank Data 2023 Update
Evaluating My Growth Predictions: Insights from the World Bank Data 2023 Update
Let's see how directionally right or wrong I am so far


Hi everyone,
Last year, I wrote an article analyzing World Bank data to assess the ten-year trends for various countries and regions. This year, I followed up with predictions on which countries will evolve in their income classification by 2030, based off data which was only updated until 2022. My predictions focused on countries not yet classified as high income, which, by Western standards, is a relatively low threshold of $14,005 per year.
As of July 5th 2024, the data for most countries in 2023 is finally available. In this article, I'll review where my predictions stand so far, giving us seven more years to see if they hold true. Additionally, I'll provide an overview of global trends over the past decade.
Caveats, Clarification, and Throat Clearing
I will be reporting incomes for countries using market exchange rates (MER) rather than purchasing power parity (PPP). Some of you may wonder why, given that PPP often provides a better reflection of a country's standard of living.
For those who are not familiar with economics, MER expresses incomes in raw dollar terms. For example, if I am an American investor in 2023 hiring Indian workers, the average Indian wage is roughly $2540 a year after converting rupees to dollars. However, one dollar goes much further in India than in America. In 2023, 1 dollar was roughly 83 Rupees. If I adjusted the average Indian worker’s income for purchasing power parity, that $2,540 would feel more like $10,030 a year. In short, while I am literally paying Indian workers $2,540 a year, it feels more like $10,030 to them. PPP aims to equalize the purchasing power of different countries by eliminating differences in price levels.
I will be using MER for the following reasons:
Reflecting International Trade: MER reflects the value of goods and services in international trade. For developing countries that need to import essential items like food, medicine, and fuel (e.g., Nigeria, Tanzania), or countries lacking natural resources that need to import fuel (e.g., Japan, South Korea), the exchange rate directly impacts their living standards. Additionally, if a country's currency is shunned by investors and it needs to borrow in dollars, then how that currency appreciates or depreciates to the dollar matters more than the local purchasing power for its domestic goods and services.
Financial and Investor Analysis: MER is better for financial and investor analysis. If you are an investor repatriating profits, you need to understand exchange rates as they affect your returns. For an American deciding between investing in China and Mexico for cost advantages, knowing how much is being spent in dollars is more important than understanding the local purchasing power given to workers.
Consistency with World Bank Classification: The World Bank classifies countries' income by MER, not PPP. Therefore, to use the World Bank’s benchmarks accurately, I need to benchmark correctly using MER, ensuring an apples-to-apples comparison.
Are my Predictions Coming true?
In Sub-Saharan Africa, I predicted that Rwanda and Ethiopia will evolve from low income to lower middle income by 2030.
In the Middle East, I made the prediction that Egypt will become an upper middle income country by 2030, and Turkey will be a high income country.
In South Asia, I expect Bhutan and Bangladesh to become upper-middle income countries.
In East Asia, I forecasted that Mongolia and Vietnam will be upper middle income countries by 2030, and China will be a high income country by 2030.
In Europe, I anticipated Bulgaria will be high income.
In Latin America & the Caribbean, my only expectations were for St. Lucia and Costa Rica to ascend to high-income ranks.
I’m happy to report that most of my predictions are on track so far.
Ethiopia, despite its conflicts, had a stellar year, growing 10.7% in a single year. The average Ethiopian now earns $1130 per year, which is $15 per person away from becoming a lower-middle income status. Unless Ethiopia’s conflicts derails its growth in 2024, Ethiopia will be the next African country to graduate from low income.
Rwanda grew by 5.4%, from $930 to $980, so it still has some way to go before reaching lower-middle-income status. The catch is that these thresholds increase every year due to inflation.
The World Bank uses a measure of global inflation to adjust their income classifications. It uses its “Special Drawing Rights” (SDR) deflator to make these adjustments. For those who don’t know, the SDR is a special pseudo-currency made by the International Monetary Fund that is a basket of major reserve currencies (43% dollar, 29% euro, 12% yuan, 8% yen, 8% pound). The SDR deflator reflects inflation rates in the major economies whose currencies are included in the SDR basket. So from 2022 to 2023, the income classification increased by the following:
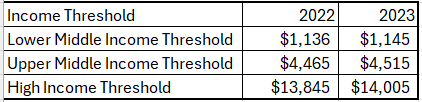
Back to my forecasts, Bangladesh grew 1.4% from $2820 to $2860, which is still a long way from $4515 per person. Again these thresholds increase each year, so if Bangladesh doesn’t grow faster than the threshold increase, then Bangladesh won’t become upper-middle income. Vietnam grew 4% from $4020 to $4160.
Bhutan is keeping us in suspense, as it hasn’t released its 2023 data yet.
Mongolia is reclassified as an upper middle income country again, growing 16% in a single year from $4260 to $4950. Hopefully it doesn’t descend again.
Bulgaria is now classified as a high income country in 2023, after growing 8% in a single year in dollar terms.
Turkey, St. Lucia, Costa Rica, and China have shown impressive growth rates of 9.5%, 7.8%, 7%, and 4%, respectively. They are all on the verge of high-income status.
On the flip side, Egypt experienced a 5% decline. Ouch.
Based on my predictions for 12 countries: 2 have already achieved my goal (Bulgaria and Mongolia), 8 are moving in the right direction (Rwanda, Ethiopia, China, Bangladesh, Vietnam, Costa Rica, Turkey, and St. Lucia), 1 is going the wrong way (Egypt), and 1 hasn’t released its data yet (Bhutan).
Any Country that I Didn’t Predict that is making moves?
Yep, there are a few:
Algeria became a upper middle-income country again. It held this classification before, but the COVID-19 crisis in 2020 severely impacted oil prices, causing a downgrade to lower-middle-income status. As of 2023, it's back in the upper-middle-income category. Given Algeria's heavy dependence on oil and gas, it remains to be seen if this growth can be sustained beyond this recovery.
Iran has also returned to upper-middle income countries (again) as well.
Palestine demoted from upper-middle income to lower-middle income for obvious reasons.
What’s crazy is that Ukraine’s economy has had a growth spurt during the war, classifying it as an upper-middle income country for the first time ever. This is driven largely by increased construction activity and investment spending to support the war effort.
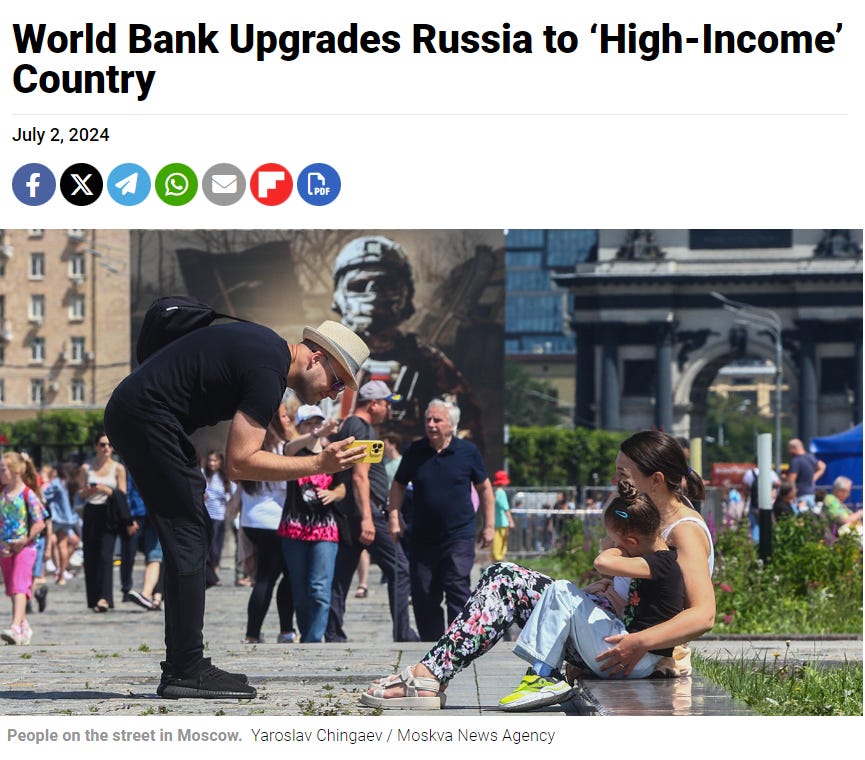
Lastly, Russia also became classified as a high income country(2nd time since the 2015 oil price bust). Despite facing sanctions for the past two years, Russia's economy has shown resilience, with military spending boosting economic activity.
Explaining Income Classifications
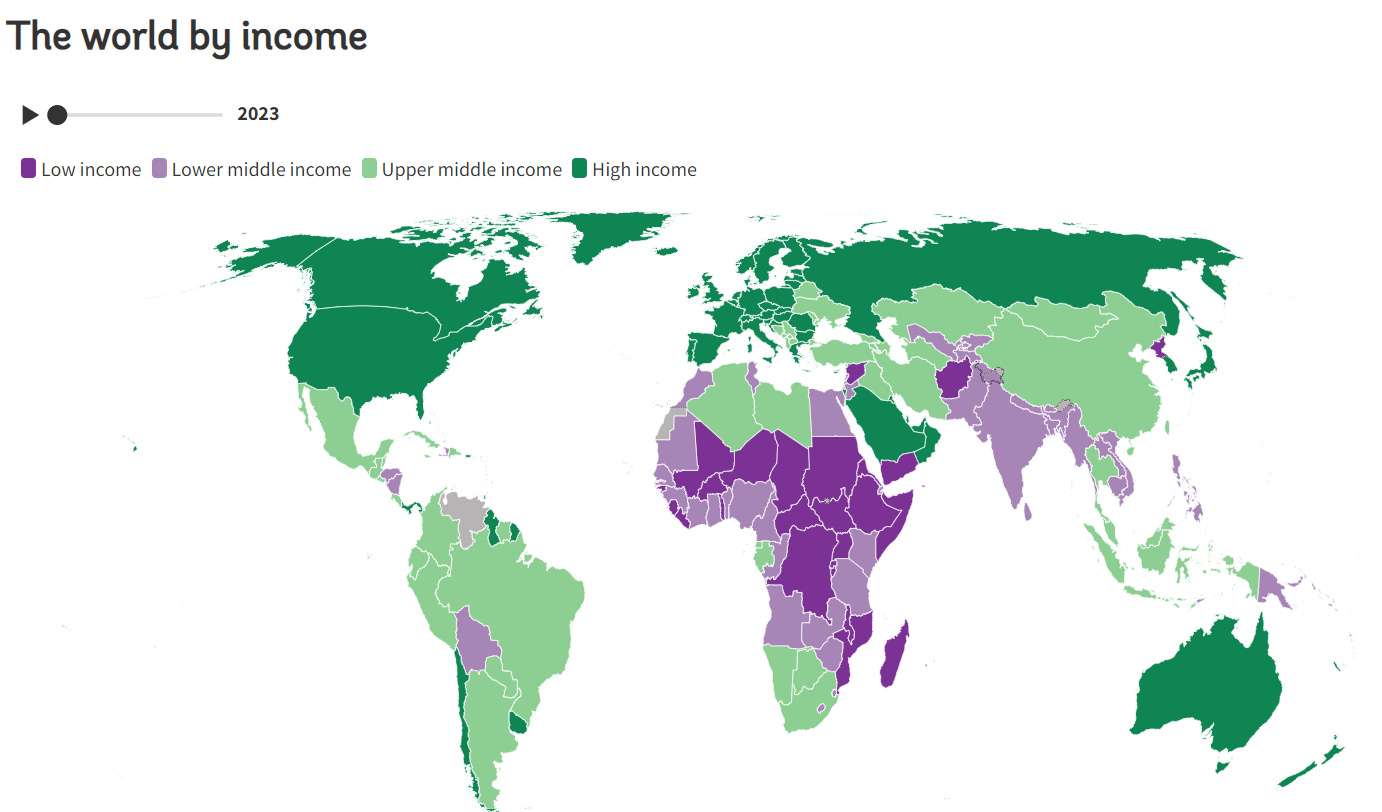
For those unfamiliar, the closest entity to an "Economic Source of Truth" is the World Bank, which collaborates with countries to provide economic statistics. They classify countries based on income, which journalists and news outlets use to report on economic growth or decline. When a country moves up an income classification, it gradually loses benefits like concessional lending, which offers below-market interest rates.
Income Classifications:
Low Income:
Threshold: Less than $1145 per year (2023 MER dollars), or less than $3.14 a day,
Examples: Afghanistan, Roughly half of Sub-Saharan Africa, North Korea, and Arab Spring War torn countries (Yemen & Syria)
Lower-Middle Income:
Threshold: Between $1,145 and $4,515 per year.
Examples: Ghana, Bangladesh, India, and the Philippines.
Upper-Middle Income:
Threshold: Between $4,516 and $14,005 per year.
Examples: “2nd World Nations” : Argentina, Brazil, China, South Africa, Mexico, and Indonesia.
High Income:
Threshold: Annual Incomes exceeding $14,005 a year
Examples: United States, European nations, advanced East Asian countries, wealthy Gulf States and Caribbean hubs like the Bahamas and Kuwait. Now it also includes Russia.
How the World is Doing? (2013-2023)
Just using World Bank data alone gives you nominal incomes. I will adjust all these incomes for inflation in 2023 prices, which is known as using “real incomes”.
How it works is that I look at a country. Let’s use Vietnam.
In 2013, the average Vietnamese made $2200 per year in US dollars at MER. Then I use an inflation adjustment calculator to put that 2013 income in 2023 prices which is $2851.
Then when I look at Vietnam’s 2023 incomes, I see that incomes increased to $4100 per year. Per year, in inflation adjusted prices expressed in US dollars, Vietnam has grew on average 3.9% per year.
If I used purchasing power parity. The average Vietnam in 2013 made $6550 in US dollars at PPP. Using an inflation adjustment calculator that’s $8,555 in 2023 dollars at PPP. In 2023, Vietnamese made $14,400 at PPP.
North America, Central America & The Caribbean
Averaging 2% to 4% inflation adjusted (MER): compound annual growth rate:
Panama, Guatemala, Dominican Republic
Averaging 0% to 2% inflation adjusted (MER): compound annual growth rate
Costa Rica, Honduras, El Salvador, United States of America, Bolivia, Grenada, St. Lucia, St. Vincent, Antigua, Barbados, Belize, Nicaragua,
Countries that are poorer than they were 10 years ago, inflation adjusted (MER)
Mexico, Canada, Haiti, Jamaica, Trinidad, St. Kitts, The Bahamas
No Data: Cuba
If you are curious about DR and Costa Rica, think of this:
Besides tourism and services (hotels, spas, and restaurants) in Costa Rica and DR, what are Dominican Republic’s and Costa Rica’s top exports? For both of them its medical device manufacturing.

DR has had free trade zones since the late 1960s. However, it was in the 1980s that the country became a hub for packaging and assembly for American medical device firms. Initially, the complex manufacturing was done in Puerto Rico, while basic packaging and assembly occurred in the Dominican Republic. Over time, more firms in Puerto Rico began transferring technology to the Dominican Republic. Today, major companies like Medtronic, Johnson & Johnson, Cardinal Health, B Braun, Beckton Dickinson, Baxter, Edwards and Fresenius Kabi operate there.
Costa Rica followed a similar trajectory. American medical device firms like Baxter came in during the 1980s. Now Allergan, Boston Scientific, Cooper Medical, Hologic and Medtronic all have manufacturing facilities in Costa Rica.
South America
Averaging 6% or higher inflation adjusted(MER): compound annual growth rate: Guyana
Averaging 0% to 2% inflation adjusted: compound annual growth rate(MER)
Bolivia
Countries that are poorer than they were 10 years ago in inflation adjusted dollars (MER):
Paraguay, Ecuador, Colombia, Peru, Brazil, Argentina, Chile, Uruguay
No Data: Venezuela
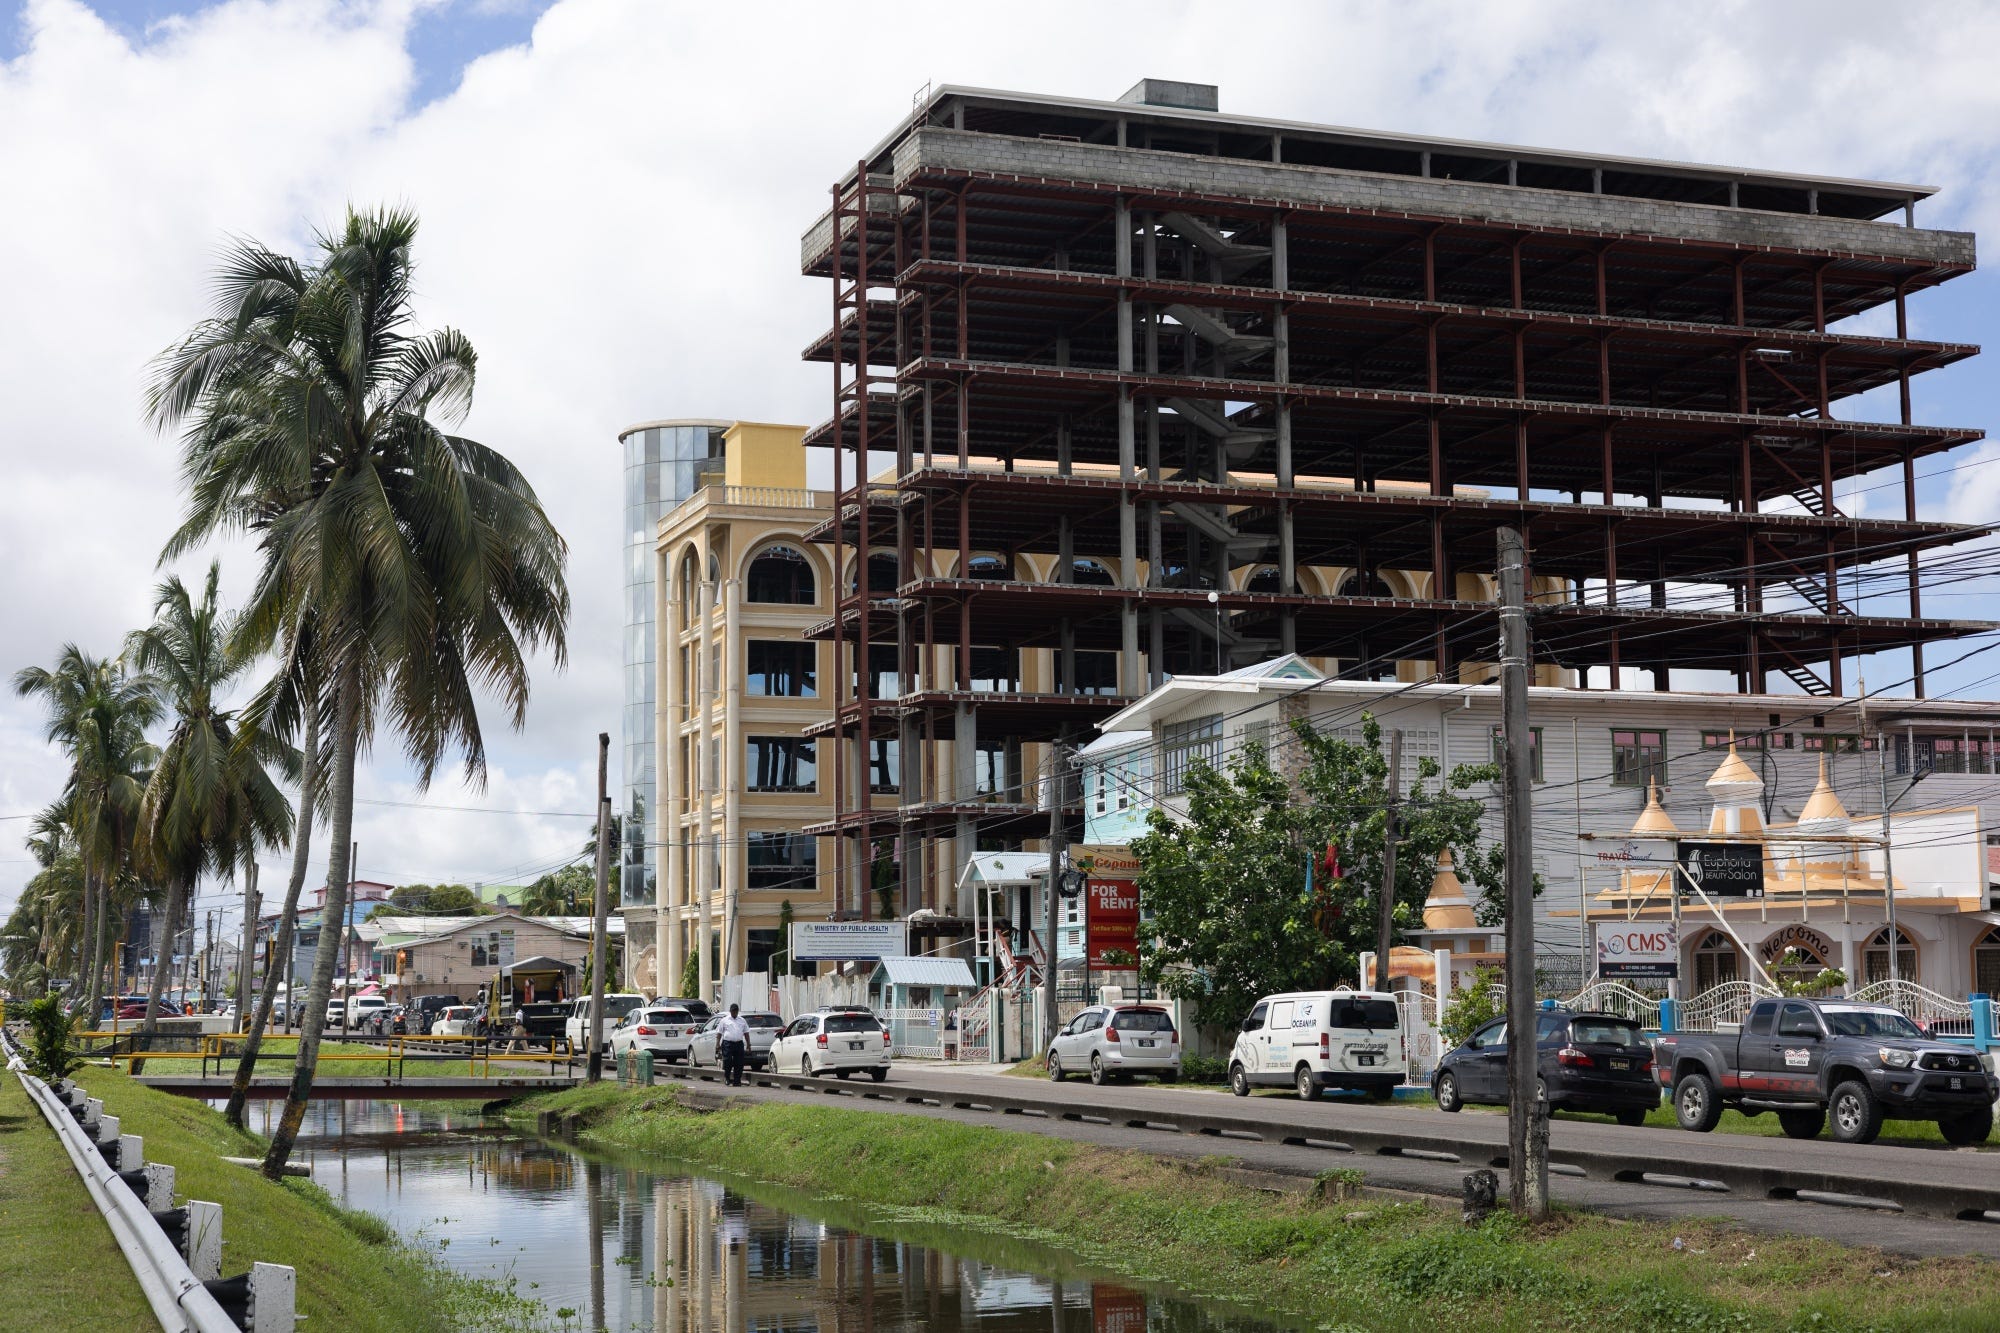
South America's performance has been lackluster, except for Guyana, thanks to its recent oil discovery. This new oil revenue allows the government to invest in healthcare and infrastructure, fueling a construction boom. Additionally, Guyana, once known for brain drain, is now experiencing a "brain gain."
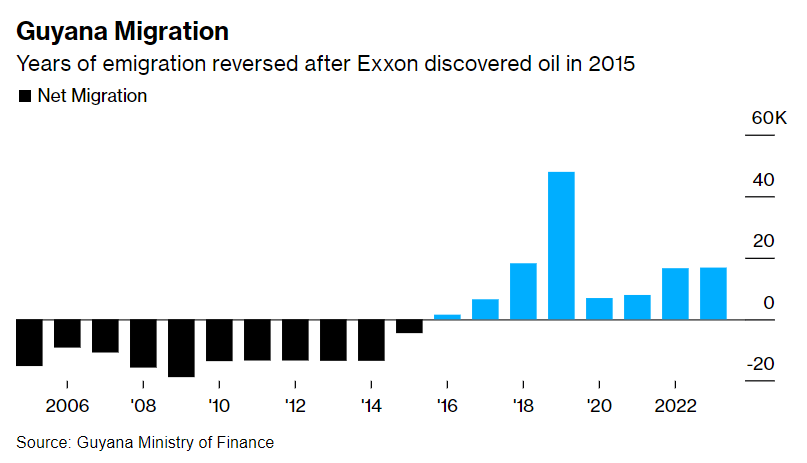
Typically, college graduates leave Guyana and never return (or return at old age), but now many young Guyanese are starting businesses and becoming entrepreneurs.
However, the situation is not without challenges. High inflation persists, labor supply struggles to meet demand, teachers are striking for better pay, and government officials are taking bribes from oil firms.
I'm not concerned about oil corruption undermining Guyana. There's a strong correlation (86% R squared) between the amount of oil exported per capita and average income. The indication is that higher oil export per capita indicates greater benefits from oil-funded government spending on healthcare, infrastructure, and other services, as the resources are spread among fewer people. See chart below:
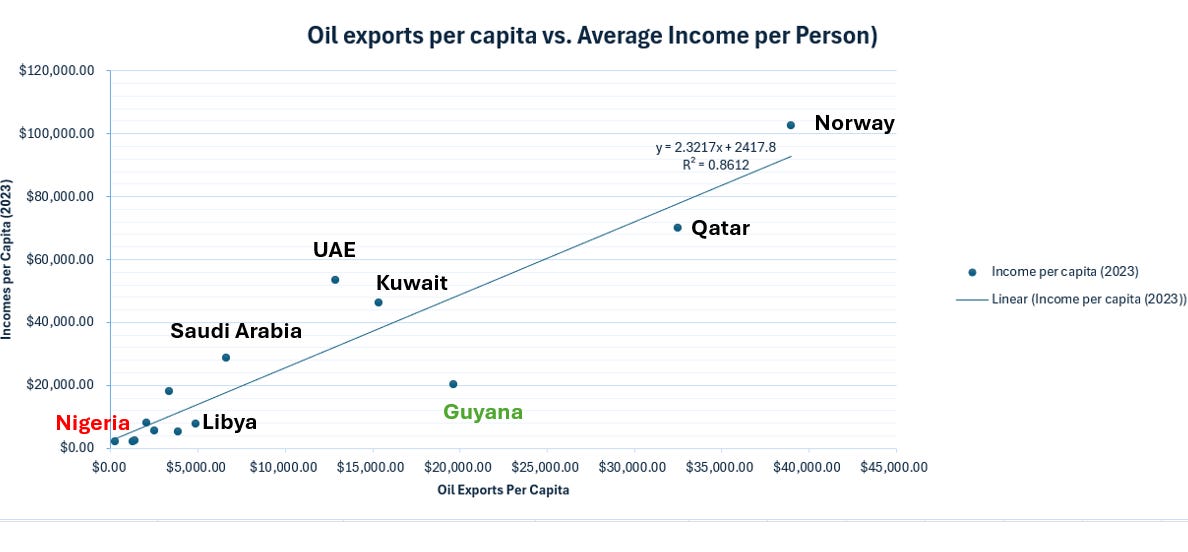
In the plot above, countries with high oil exports per capita generally have higher average incomes. For example, Norway and Qatar, which have significant oil exports relative to their small populations, are richer than Saudi Arabia. Saudi Arabia, in turn, has higher income levels than most African oil-producing countries, such as Nigeria, which has the lowest oil exports per capita and correspondingly lower incomes.
Compared to other countries in the plot, Guyana, however, is positioned well below the line of best fit, indicating that its income levels are currently below their potential given its oil exports. This is understandable, as Guyana only recently began exporting oil and is still experiencing rapid growth.
To illustrate the impact of oil exports per capita, consider Qatar and Nigeria. Both countries have substantial oil and gas revenues (Qatar: $88 billion, Nigeria: $61 billion in 2022). However, Nigeria's large & fast growing population (supposedly 220M+) and massive demand for foreign imports, dilutes the benefits of its oil revenues. This leads to frequent current account deficits in Nigeria as it imports more goods than it exports in oil. The deficits are particularly acute when global oil prices fall. In contrast, Qatar's small population (less than 3 million) allows for greater per capita benefits from its oil revenues, contributing to its more frequent current account surpluses even when oil prices drop, a larger sovereign wealth fund, and higher income levels.
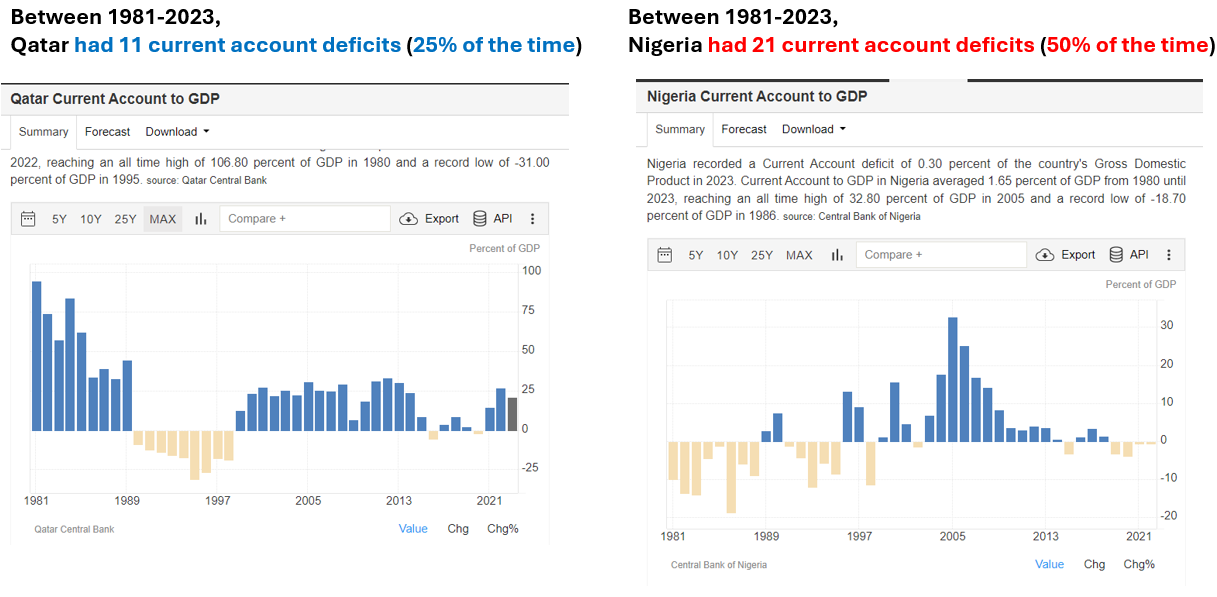
Like Qatar, Guyana possesses a small population relative to its oil exports. This means, unless oil prices crater, it cannot consume enough imported goods to exceed its oil exports, unlike Nigeria. This allows Guyana to maintain higher living standards despite potential corruption, similar to Gulf states and Libya, which also sell abundant oil resources relative to their populations. In contrast, Nigeria's large population dilutes the benefits of its oil revenues, making it harder to provide the same level of prosperity.
European Union & Allies
Averaging 2% to 4% inflation adjusted: compound annual growth rate (MER):
Kosovo, Moldova, Albania, Bosnia, Bulgaria, Romania, Lithuania, Iceland, Ireland
Averaging 0% to 2% inflation adjusted: compound annual growth rate (MER)
Ukraine, North Macedonia, Montenegro, Poland, Hungary, Croatia, Latvia, Czechia, Estonia, Slovenia, Malta
Countries that are poorer than they were 10 years ago in inflation adjusted dollars (MER):
Belarus, Greece, Slovakia, Portugal, Cyprus, Spain, Italy, France, Netherlands, United Kingdom, Norway, Finland, Germany, Belgium, Austria, Switzerland, Sweden, Denmark, Luxembourg
By dollar standards, the main areas of growth in Europe are Eastern Europe and the tax haven of Ireland. Since these EU countries borrow in Euros and import goods in Euros (and dollars), Europe does not feel poorer than America unless you compare wages in high end industries or compare the average American’s ability to buy a home in Europe vs. the average European’s ability to buy homes in America.
Eurasia, Central Asia, & the Caucuses
Averaging 2% to 4% inflation adjusted: compound annual growth rate(MER):
Armenia
Averaging 0% to 2% inflation adjusted: compound annual growth rate(MER)
Georgia, Kyrgyzstan
Countries that are poorer than they were 10 years ago in real incomes(MER):
Kazakhstan, Azerbaijan, Uzbekistan, Tajikistan, Russia
No Data: Turkmenistan
The Eurasia region, primarily composed of commodity exporters, has seen limited growth since the 2015 commodity crash. Only non-commodity exporters like Armenia have experienced significant growth.
The Middle East
Averaging 0% to 2% inflation adjusted: compound annual growth rate(MER):
Israel
Countries that are poorer than they were 10 years ago in real incomes(MER):
Most of them
No Data: Syria, Yemen, Qatar
Most of the Middle East falls into five categories:
1. Countries that were ravaged by the Arab Spring (Syria, Yemen),
2. Mismanaged Lebanon
3. Inflation ravaged Turkey,
4. Palestine
5. Countries ravaged by the oil price bust due to the shale revolution and China’s end of the commodity binge. Many oil states had to borrow or tap into their central bank reserves or sovereign wealth funds to stabilize their economies. Bahrain and Oman needed Marshall Plan-style aid packages from Kuwait, Saudi Arabia, UAE, and Qatar to stay afloat.
The only country in the Middle East that managed decent growth in dollar terms was Israel.
Africa
If you've been following me for a while, you'll know I’ve said the "Africa Rising" period ended in 2014, and those still claiming "Africa is Rising" need to update their priors.
Out of the 54 African countries only a quarter of them, are growing adjusted for inflation. The remaining 75% are either stagnant or poorer than they were in 2013.
Nigeria exemplifies this decline, hit hard by the post-2014 commodity price bust and COVID. Conversely, Ethiopia, which doesn't sell $1 billion in any mining commodity, has grown primarily through agriculture and services.
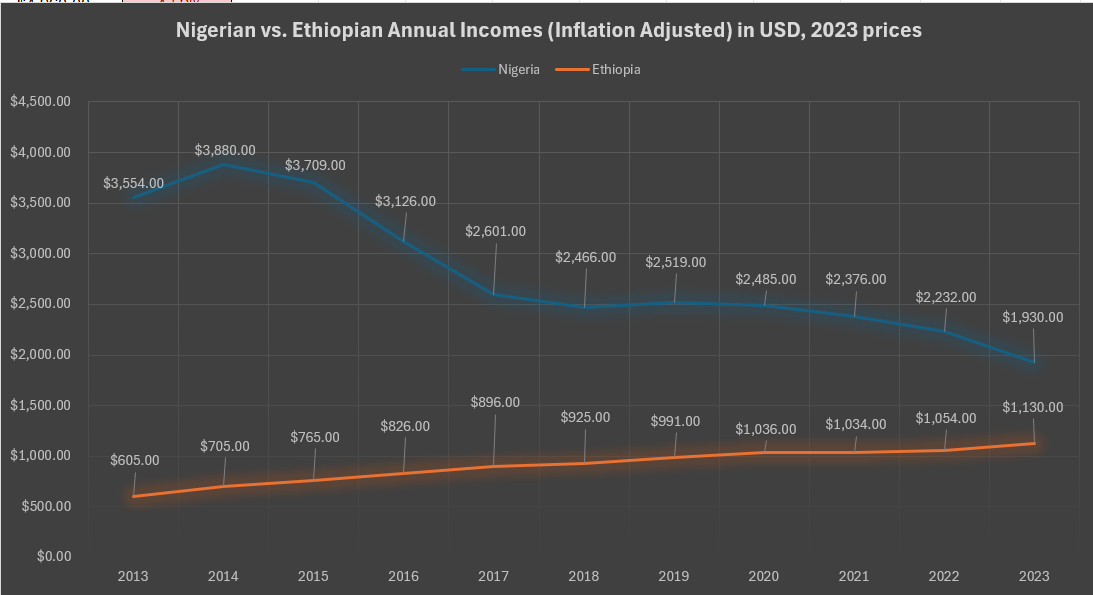
Averaging 6% or higher inflation adjusted: compound annual growth rate(MER): Ethiopia
Averaging 4% to 6% inflation adjusted: compound annual growth rate(MER):
Somalia , Guinea, Ivory Coast
Averaging 2% to 4% inflation adjusted: compound annual growth rate(MER):
Central African Republic, Kenya, Sao Tome & Principe, Djibouti, Democratic Republic of Congo
Averaging 0% to 2% inflation adjusted: compound annual growth rate(MER):
Guinea-Bissau, Rwanda, Tanzania, Zimbabwe, Egypt, Seychelles
Countries that are poorer than they were 10 years ago in real incomes(MER):
Most of them
No Data: South Sudan, Eritrea
South Asia
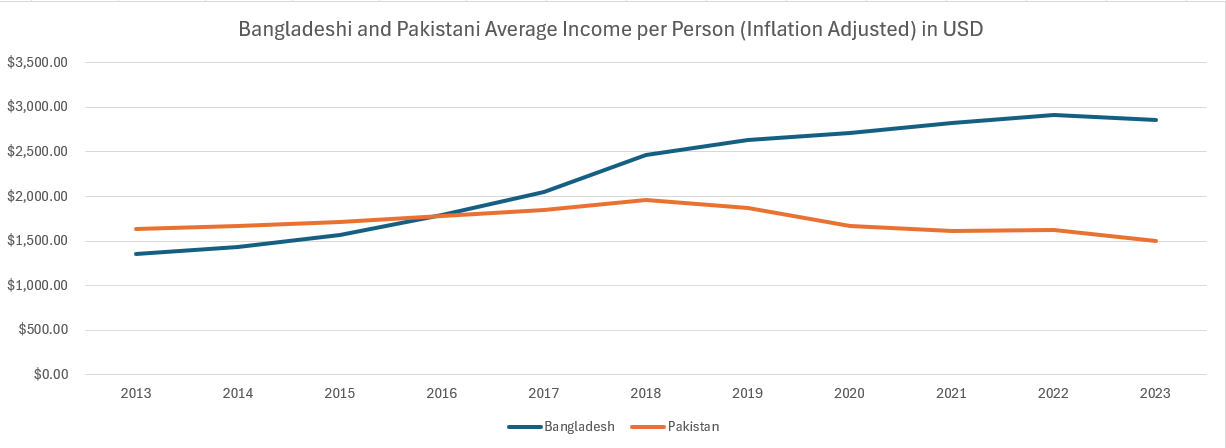
South Asia is divided into two groups: growth stories (Bangladesh, Nepal, India, Maldives) and failing states (Sri Lanka, which grew rapidly until defaulting in 2022, Afghanistan, Pakistan).
Bhutan and the Taliban haven't provided the World Bank with updated 2023 numbers. As of 2022, Afghanistan is the world's second poorest nation.
Averaging 6% or higher inflation adjusted: compound annual growth rate(MER):
Bangladesh
Averaging 2% to 4% inflation adjusted: compound annual growth rate(MER):
Nepal, India
Averaging 0% to 2% inflation adjusted: compound annual growth rate(MER):
Maldives
Countries that are poorer than they were 10 years ago in real incomes(MER):
Pakistan, Sri Lanka
No Data:
Bhutan, Afghanistan
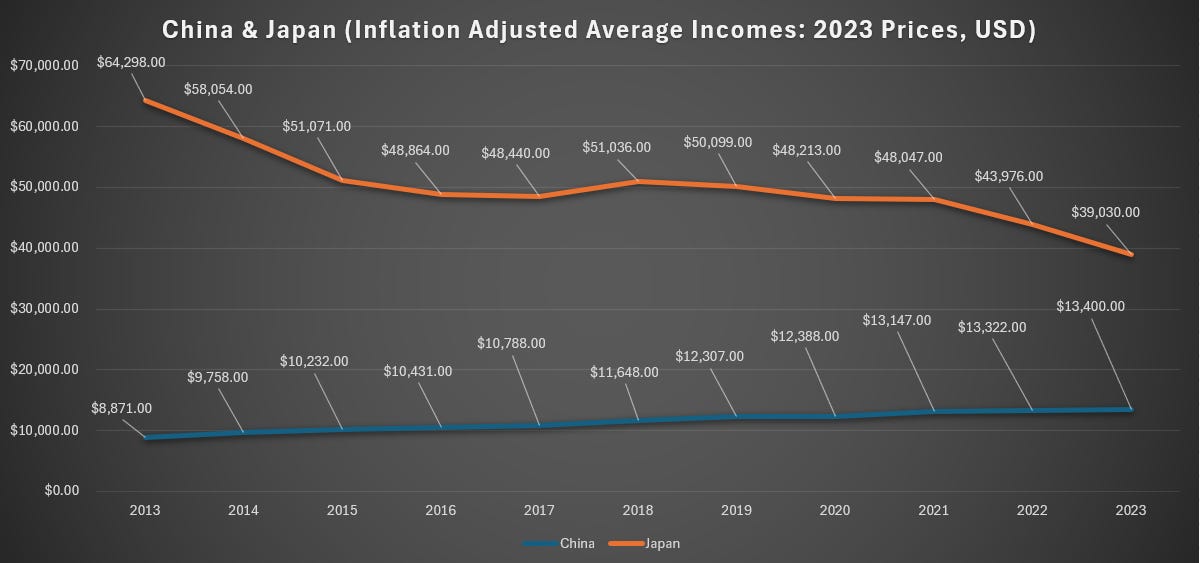
East Asia, South East Asia, & Pacific
Averaging 4% to 6% inflation adjusted: compound annual growth rate(MER):
China
Averaging 2% to 4% inflation adjusted: compound annual growth rate(MER):
Cambodia, Vietnam
Averaging 0% to 2% inflation adjusted: compound annual growth rate(MER):
Hong Kong, Laos, The Philippines, Indonesia, Singapore, Taiwan
Countries that are poorer than they were 10 years ago in real incomes(MER):
South Korea, Japan, Australia, New Zealand, Mongolia, Myanmar, East Timor, Papua New Guinea, Thailand, Malaysia, Brunei
No Data: North Korea, Macao
Despite China's real estate bust, it remains the fastest-growing country in the region over the past decade. China has evolved from being a factory for the West and Japan to creating its own world-class brands.

Only a few countries manufacture their own planes due to the industry's high barriers to entry, including technical expertise, time, and resources. Despite Japan's long-standing industrialization and advanced military aircraft, Mitsubishi still can't produce commercial planes that compete with Boeing or Airbus.
Concluding Thoughts
In short, Africa has experienced another lost decade, with only pockets of growth in Ethiopia, Rwanda, Seychelles, and Ivory Coast.
Latin America isn't reaching its potential, except for the Dominican Republic, Costa Rica, Panama, and oil-rich Guyana.
Growth in Europe is concentrated in Eastern Europe. America grows while Canada stagnates.
The Middle East has stagnated since oil prices dropped post-2014.
China's growth is fast but slowing, partly by design, as it shifts focus to "quality growth." Meanwhile, the Economist's "AltAsia" region, including Bangladesh, India, Vietnam, and Cambodia, is experiencing fast growth, while Singapore(already rich), Indonesia, Laos, and the Philippines see steady but slower growth.
Links are underlined!
> Ethiopia, despite its conflicts, had a stellar year, growing 10.7% in a single year.
Sucking at agriculture really is worse than sucking at peace. Agriculture and services should be the focus for now.
Funny to see Baxter. I work there doing software and I know we recently offshored some manufacturing to Mexico and other spots in LA as you mention here