

How Accurate are IMF Forecasts?
The More Advanced the Economy, the More Accurate Their Forecast Is

As we approach the end of 2023, the IMF's forecasts for both this year and 2024 have been released.
The question is: “How accurate are IMF forecasts?”
The answer: it’s more of an art than a science. Look here to see how accurately they forecasted Netherlands’ growth but how terribly they forecasted Sierra Leone. The poorer the country is, the greater the uncertainty.
Forecasting is about predicting the future, and many things can happen that can completely change the fate of a country. For example, China in the early 2000s, when it was a lower-middle income country, consistently beat IMF’s estimates. They were not expecting China to grow double digits per year, adjusted for inflation, in the early 2000s. China sustained the longest and fastest economic growth human history, discounting petrostates in the Persian Gulf. It transformed its economy from a country where per capita incomes were poorer than black Africans or Indians in the 1960s to Deng Xiaoping making unique government and market based reforms. These reforms led to the outcome where the average Chinese is richer than average Brazilian, Russian, or Turk despite a much larger population in 2022.
The IMF makes assumptions and sometimes their forecasts are off by three percentage points or more for developing countries. Considering that average growth is around 2.5% to 4%, being off by three percentage points is huge! Below, you will see how the IMF consistently underestimated China (under zero means the IMF underestimated, above zero means the IMF overestimated.) More often than not, they weren’t expecting China to grow this fast, but then the IMF improved their projections by 2010. Post 2010, IMF’s predictions on China have been almost spot on.

**Note: I am specifically using percentage points to describe differences instead of percent change to be less confusing. Let me explain why:
If Saudi Arabia grew at 8% but the IMF forecasted 5%. The percent difference between 5% to 8% is actually a 60% difference
Remember your percent difference formula from grade school? Percent change formula: ( (new - original)/ (original) ) * 100
So when these forecasts are wrong, they are really off. I am using percentage points to simplify this discussion and make it clearer.**
Do these forecasts matter?
Less than you think in some areas, but more than you know in others. If you are an entrepreneur in your home country, and the IMF predicts you will have terrible growth, that may not stop you from setting up your business in your country. Why? Because maybe growth rates of that country isn’t your only factor in starting up a business. Maybe the specific market you are focusing on is a fast growing sector. Maybe you understand that country better than others.
But if you are a multinational firm looking for places to grow, you might take the IMF forecast more seriously. Some firms may think they can do a better forecast than the IMF and some firms trust the IMF as a benchmark.
If you are an economist, trader, finance minister, central banker or policy maker, then you will definitely take these forecasts more seriously, because you might have to talk about how your country is benchmarked to the forecast.
How Accurate are the Forecasts on the Whole?
Below you will see a graph on how well the IMF has been predicting growth rates for the globe between 1980-2022. In short, the IMF is usually decently accurate but has periods of when the IMF tends to be too optimistic. The IMF also notoriously underestimated how bad the Great Financial Crisis of 2008 was. When growth declined in the 2008 recession, the IMF predicted a -0.1% drop in global output, the actual drop was -1.3% globally.

What about Economic Regions?
You might be thinking “Ok Yaw, maybe the IMF is somewhat decent, if not a little too optimistic about at predicting global growth/decline. But what about advanced economies vs. emerging economies?
Glad you asked. The IMF definitely has an easier time predicting developed economies than developing nations. Below you will see a graph of error bars for growth rates from 2000-2018. The higher the bar, the higher the difference between the actual growth rate and the IMF forecast. For developed economies, there are more accurate forecasts where growth is within a 1 percentage point difference. There aren’t any differences that exceed 2.5 percentage point difference in GDP growth.
For emerging & developing economies, the IMF’s accuracy has only been within 1 percentage point difference in GDP growth in 2018, but there have been far more times where the forecasts have been off by 2.5 percentage points in GDP growth.

What about Specific Countries?
Here’s the fun part. For specific countries, specifically in Africa the IMF is pretty bad at predicting growth rates! Let me show you how great the IMF is at predicting American growth rates (one the left), but horrific for Zimbabwe (on the right).

However, it’s worth noting that after 2012, the IMF forecasts for Zimbabwe have gotten significantly better. In fact, since 2012, IMF has gotten better at forecasting developing countries.
If we had to rank countries by “fairly accurate to terrible forecasting” by judging from 2013-2018, here are the projections by region by percentage points:
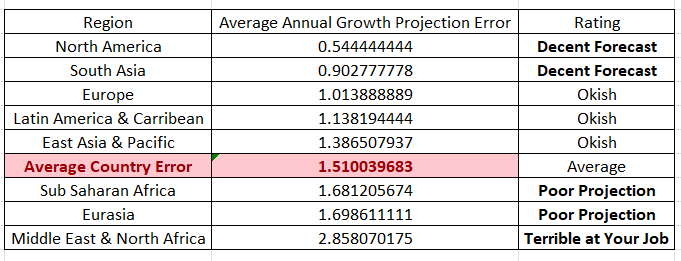
In short, for regions where their economies are primarily commodity exporters (the Middle East, Africa, Russia, and Central Asia), the IMF does a poor job projecting economic growth in the region since these economies mainly export commodities to sustain their economy — copper, oil, gas, cobalt, etc. It makes sense why the IMF would be poor at projecting growth for commodity exporters, because commodity prices are volatile. Very few actors, especially not the commodity exporting countries were projecting that 2014 would crash most commodity prices and hurt their economic growth.
For countries that don’t depend on volatile commodities to export but rather less volatile exports such as manufactured goods (Asia, Europe, & North America), tourism (Caribbean), or food (Latin America), it is much easier to predict economic growth.
What did the Forecast Say?
Now that I have done some throat clearing. I can finally get into what the forecasts actually say.
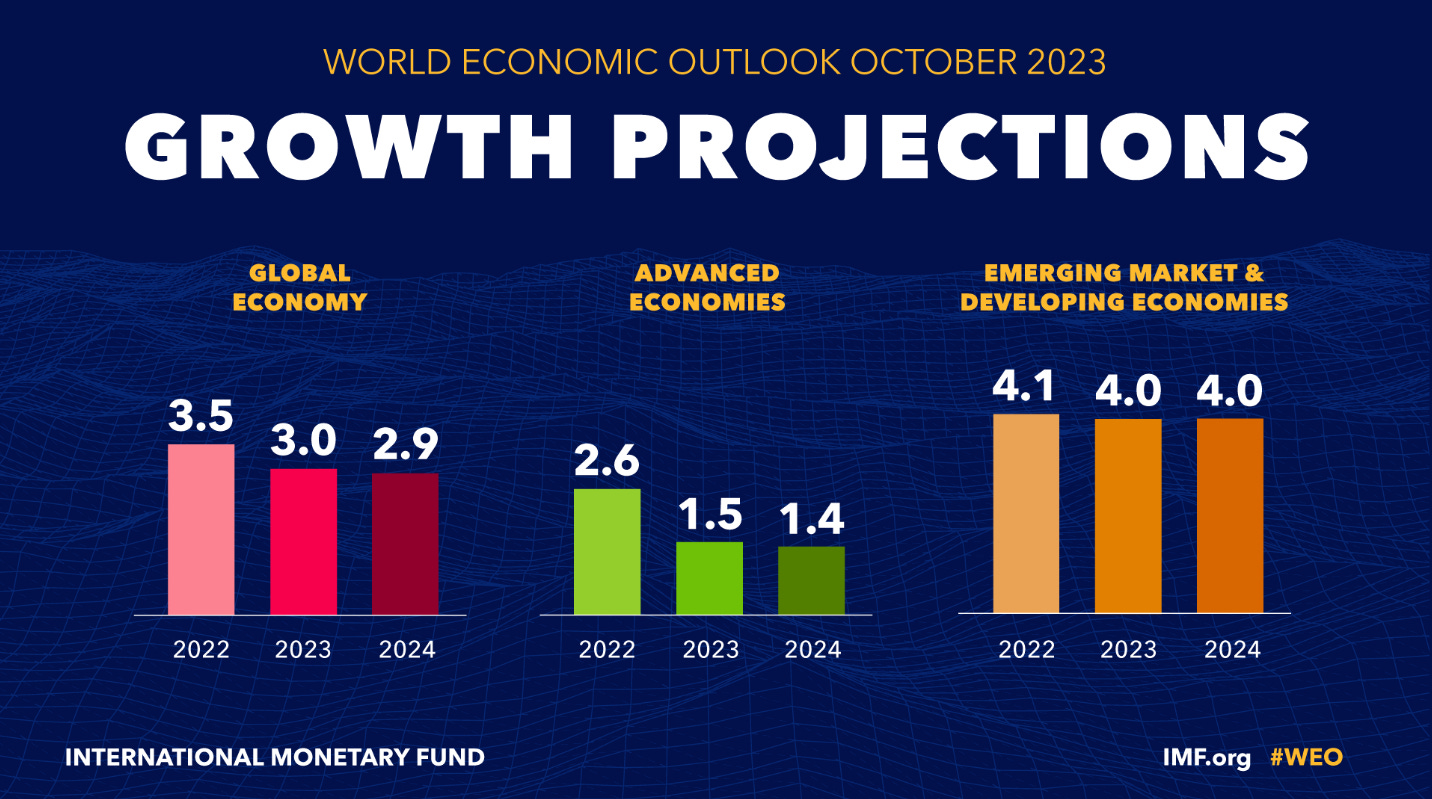
The IMF projects an average of 3% inflation adjusted growth (also known as Real Growth) for 2023 & 2024. Advanced economies are expected to grow around 2%, but for emerging economics the IMF expects 4% growth.
Using rule of 72, growing at 4% real growth means it takes roughly 18 years to double living standards for the average person. Growing at 2% means it takes roughly 36 years to grow living standards.
Let’s look at projections for individual countries in terms of transformation:
Low Income to Lower-Middle Income country by 2025:
The IMF predicts than by 2025, Ethiopia will evolve from low-income country to a lower-middle income country. This is a big deal for a country with over 100M people.
*Keep in mind lower-middle income is still quite poor, it means the average person makes more than $3.11 a day or $1135 a year. There are currently 20 Sub-Saharan African countries that are lower middle income.
Lower-Middle Income country to Upper Middle Income country by 2025:
The IMF also predicts Cape Verde, Jordan, and Mongolia will be an upper middle income country by 2025. (Upper Middle Income means your country makes between $4466 to $13,845 a year. These benchmark numbers increase every year due to inflation).
Most Latin American countries, Eurasian countries, and the least developed Eastern European countries are upper-middle income countries. By American standards, even upper-middle income countries are still considered poor. Mexico is an upper-middle income country, yet many Americans who have never been there picture Mexico as a failed state.
1st World Status by 2025:
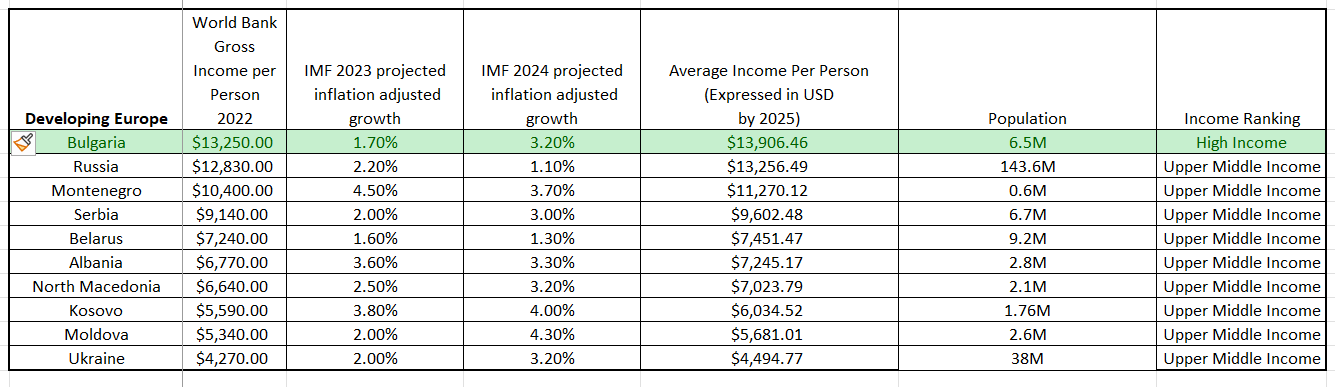
Lastly, IMF projects Bulgaria and China will be a high income, 1st world economies in 2025. High Income means your average citizen makes over $13,845 in 2024 USD (the threshold will be higher every year due to inflation). Here are examples of High Income countries:
The West: USA , Canada, Australia, New Zealand, Israel, Most of EU
Rich Asia: Japan, Singapore, South Korea, Taiwan, & China by 2025
Oil & Gas-Rich Gulf States: Oman, Saudi Arabia, UAE, Qatar, Bahrain, Kuwait
Tax Haven Caribbean Islands: Anguilla, Cayman Islands, Bahamas, Barbados
For North America, Oceania, much of Europe, Rich Asia, and some of the gulf states, their average incomes are so high by world standards that, on average, people make over $40K a year.
Other high income countries that don’t fit those categories are Seychelles, Chile, Uruguay, and the oil & gas rich Trinidad and Guyana which just discovered lots of oil this year!
When you look at the incomes per person below, I list them in current prices as opposed to purchasing power parity prices. Why did I do that?
Mainly because I am using World Bank classifications:
But what does it mean to use current prices over purchasing power parity?
Let me explain: the average South African makes almost $7000 a year when you convert Rand to US dollars. That sounds poor, but due to lower living costs in South Africa, their income adjusted for PPP is closer to $16,000 per year. $16,000 a year (still poor by American standards). What this means is that if I had a business in South Africa and I wanted to pay an average South African wage, I would just need to pay him $7K a year. But to that South African, that would feel more like $16K a year.
Same thing with Russia. If you wanted to pay a Russian the average salary, you just need to shell out ~$13K a year. But that $13K to a Russian feels more like $36K since goods are cheaper there.
Look below to see IMF projections for each country by region:
Developing Europe:
Developing MENA region:

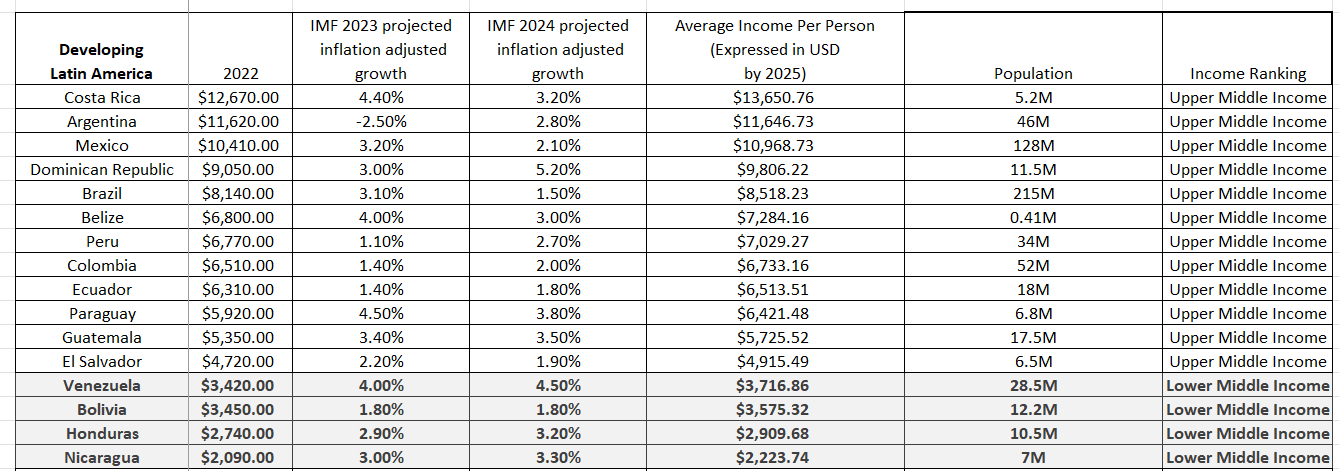
Developing Latin America:
Developing Eurasia & Central Asia:

Developing East Asia & Pacific:

Developing Caribbean:

Developing South Asia:

Sub-Saharan Africa


Interesting, always. I particular liked the earnings comparison, South Africans getting an average $7K a year but that our buying power feels more like $16K . I add that the average USA income is $67,521. Helluva perspective.