

How do you know how well the World is doing?
Readers may have differing backgrounds on international econ when they read my posts, so here’s a primer

How do you know the average income of a person in a country?
Income per person is determined by taking the Gross National Income or Gross Domestic Product (these numbers are mathematically supposed to be equivalent, but usually differ slightly due to statistical or data collection errors) and divide by the total population. Brazil’s GDP per capita is $7500 and gross income per person is $7740. Countries have a national statistics bureau (China has the National Bureau Statistics of China and Kenya has the Kenya National Bureau of Statistics) that report their GDP, inflation, and employment numbers to the public and international financial agencies like the World bank and International Monetary Fund (IMF). The World Bank then changes the data to be priced in dollars. The World Bank will display income per person using current exchange rates (nominal income per person) or adjusting the income per person encompassing the different purchasing power of that currency for different goods/services in that country (income per person at purchasing power parity).
For economies that are not high income economies, the income per person at purchasing power parity(PPP) is usually much higher than nominal income (current exchange rates) due goods & services are less expensive in poorer countries. That means the same amount of money goes much farther in South Africa than it does in the United States, since the US has a higher cost of living.
So if I look at South Africa: Nominally, yearly income per person is $6530. But if I look at purchasing power parity and adjust for cost of living, the average South African makes closer to $14,340 (which is still poor by Western Standards but is upper-middle income by world standards). This is because goods & services in South Africa are cheaper than in the United States. If we take one extreme example like rent in expensive cities, average rent in Johannesburg, South Africa for a 1 bedroom in the city is ~7000R per month, which is roughly $400. In NYC, the average rent is $3800.
How is Purchasing Power Parity Calculated?
If I compare South Africa and United States. I would take a basket of goods & services that are commonly used by households in those countries, do a weighted average of the prices, and compare the two (electricity, rent, food, transportation etc.), the ratio of the the weighted average price between countries is the PPP exchange rate. The International Comparison Program (ICP) by the World Bank allows you to see these comparisons.
Is GDP a good measure of income?
Yes because at the end of the day GDP is income. Gross domestic product is mathematically equal to gross national income. But GNI or GDP per capita doesn’t look at inequality or health such as the Wealth/Income Gini Coefficient or the human development index. These metrics should be included to encompass the totality of an individual’s human flourishing in a nation. For example, the average yearly income of a Haitian is $1430, while the average Rwandan’s yearly income is $840. Does that mean Haiti is a better example of human flourishing? Only if you strictly look at income.
If I look at the human development index, a composite metric of life expectancy, yearly income, and average years of schooling assembled by United Nation’s Human Development Report, Rwanda’s HDI is .534, while Haiti’s is .535. Even though Haitians make almost double of what Rwandans make, their human development indexes are basically equal. How? Haiti beats Rwandan’s income due to the Haitian diapora’s remittances boosting Haitian’s incomes(Haiti has one of the highest remittance/GDP ratios of any country, remittance payments are a fifth of Haiti’s GDP and nearly 7x the rate of Rwanda’s remittance rate). Meanwhile, Rwanda has outclassed Haiti in healthcare & education due to Rwanda’s government massively reducing child morality and achieving near universal access to primary education. Mathematically with the statisticians are crunching the numbers with their metrics to make an HDI, the countries end up being functionally equal in human development.
What is GDP?
GDP is the final added value of goods and services. If you add business investment, government investment, domestic consumption and net exports (exports-imports), you get GDP. If you buy a new computer for $100, domestic consumption goes up by $100 and so does GDP. If the government buys an fighter jet from Boeing for $30M, then GDP goes up $30M.
The final part is important because the intermediate goods (parts to make a bike, buying stocks or bonds) are not included to GDP. Why aren’t intermediate goods included? It would be double counting. Intermediate goods are inputs in the production of goods and services. Also buying a stock isn’t consumption, it’s not a private business spending, it’s not the government spending, nor is it an export.
The Formula for Gross national income is the aggregation of wages, business profits, rental income, dividends from stocks, interest income, and government revenue (taxes) minus government subsides & import subsides. GNI equals GDP + (money from residents earning money abroad - money from non-residents earning money at the nation). (The number will be off by a little bit but that’s due to statistical error). Gross income per person will always be higher than average or median salaries of the country because only a small proportion of the population owns investment property (~6% in U.S., 10M/164M tax payers), earns interest from bonds (~30% in U.S.,48M/164M tax payers), or earn dividends from their stocks (~20% in U.S., 31M/164M taxpayers) . You can get all this information from the IRS’s tax return data. An American’s average & median wage is $60,575 & $45,760, but the average American’s gross total income per person is $70,930. The difference reflexes the inequality and access to bond/dividend/rental income.

Are there any databases for inequality?
The Paris School of Economics’ releases the World Inequality Report(WIR) every year on wealth and income inequality. Here’s some of the stats from the WIR, ranked by wealth inequality.
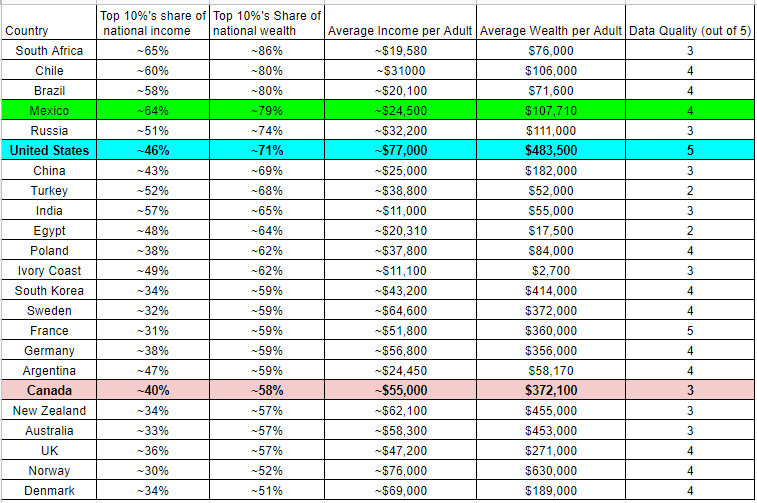
Denmark is the most equal state on earth and Denmark calls itself a free-market, capitalist economy with a strong welfare state. Denmark has its highest marginal tax rate (42%) kick in for anyone who makes above than 57,200 krona ($8300 per year) which means everyone lower-middle class or higher pays high taxes. If you make total investment & wage income over 552,200 krona ($54,000 per year) you pay an additional 15% tax! Denmark also has a VAT tax (it’s a consumption tax) of 25%(as for all countries in the EU).
How are countries ranked from low, lower-middle, upper-middle, or upper income?
Income rankings are determined by the World Bank and International Monetary Fund. If a country’s average nominal income per person is lower than $1085 per year, the World Bank would call that a low-income country (Burundi, Afghanistan, Yemen). Low income nations have issues of illiteracy, poor health, lack of nutrition, and etc. Lower middle income is between $1085 to $4255 annual nominal income per person(Nigeria, Pakistan, India,). Upper middle income is between $4255 to $13,205 annual nominal income per person(Brazil, Russia, China). Upper income is over $13,205 nominally per person (America, EU, Japan).
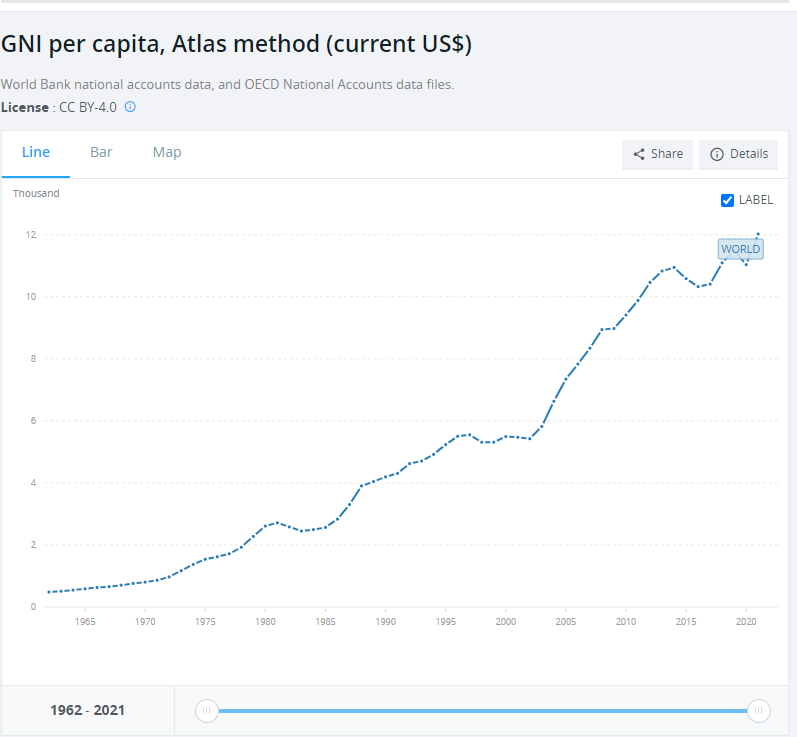
In 1960, with the exception of Europe, America, Canada, Australia, and New Zealand, every nation on earth was low income. Most of the World has graduated from low income and now only very few nations are in extreme poverty. If the world was a country, in 1960 it would be a low income country with abject poverty. By 1970, it would have become lower-middle income, and by the 90s it would be upper-middle income. As of 2021, if the world was a country, the world citizen would have an annual income slightly higher than a Russian or Chinese person.
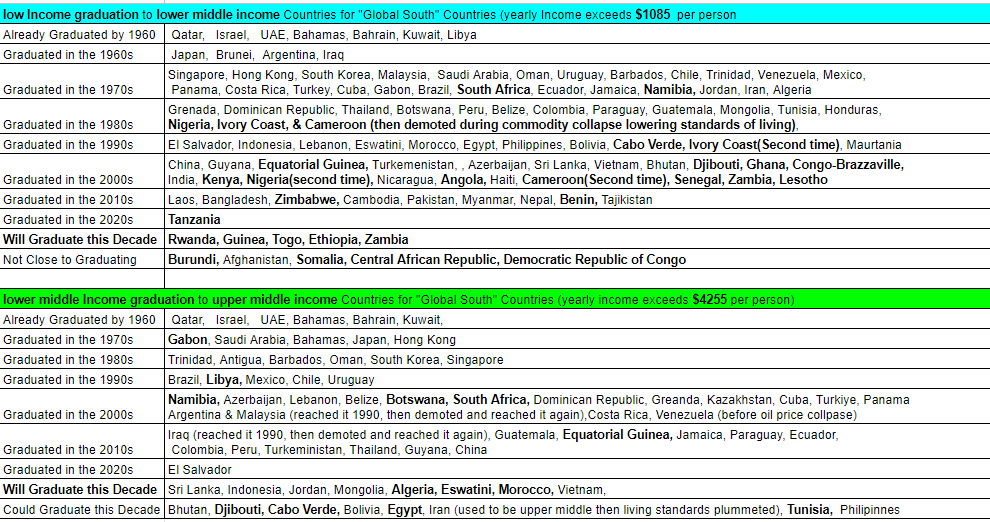
Roughly Half of Sub-Saharan Africa has graduated from low income to lower middle income. However, lower middle income is still poor by Western Standards. To the average American, lower middle income is still “third world”. Nigeria, Ivory Coast, and Cameroon are the only African countries to have reached lower-middle income in the 80s, then after commodity price collapse (falling price in oil, cocoa, etc.) living standards fell, and then they got back to lower middle income again by 90s (Ivory Coast) and 2000s (Nigeria and Cameroon).
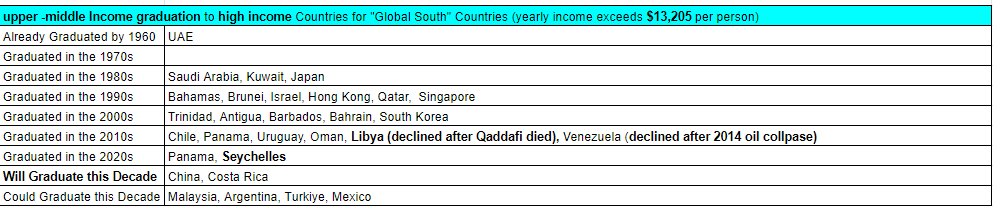
Very few “Global South” nations have traditioned to high income countries. Mainly oil rich gulf states, Israel, touristy Caribbean countries, East Asia, and some Latin American nations. By 2030, China and Costa Rica will definitely be high income as well. In fact, unless China has a recession, China will be a high income country by this year, 2023. Venezuela and Libya used to be high income but due to oil price collapse in 2014 with very little reinvestment & maintenance into its refinery capacity and NATO arming rebels to murder to Gaddafi after the Arab Spring, these countries have collpased from high income status.
ALL SOURCES ARE LINKED